How to use the Riparian Restoration to Promote Climate Change Resilience (RPCCR) Tool
You must use either Google Chrome or Firefox Mozilla to access the Riparian restoration tool.
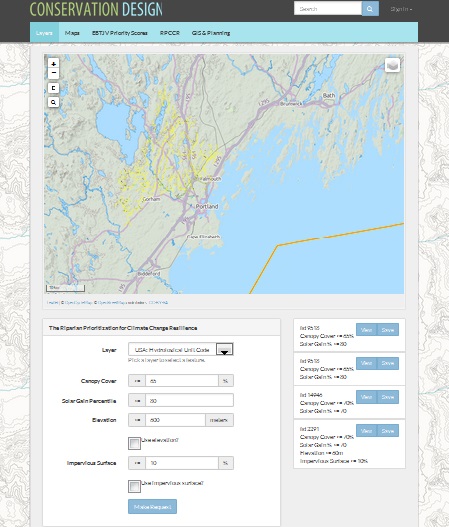
1) Choose a layer from the drop-down list and click Select Feature.
2) The map will change, highlighting your selection.
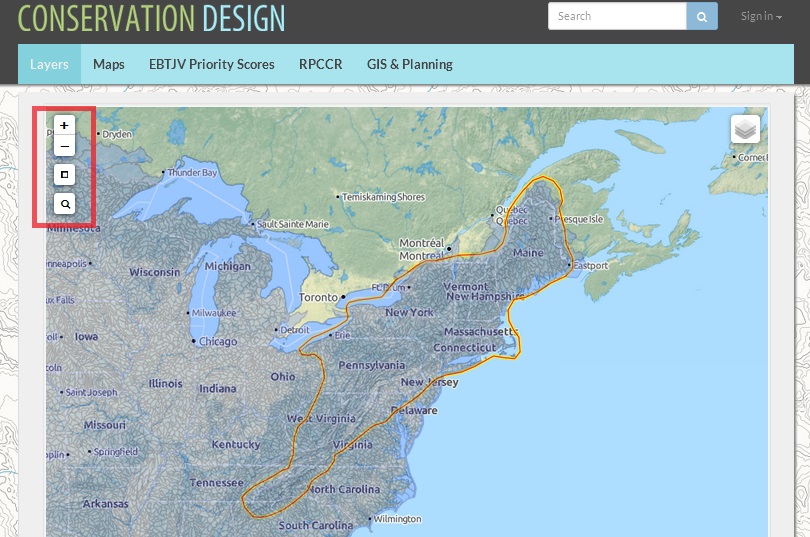
3) Zoom to select the polygon (or state) that you want to analyze using the buttons in the red box. Select the polygon (area) that you are interested in by clicking in that area.

4) Fill out the selection fields, including minimum canopy cover and maximum solar gain. You can also select on minimum elevation and/or maximum impervious surfaces by clicking in the check box under those criteria.
5) Click Make Request.
After you click Make Request, the request(s) will appear in boxes on the right with "working" displayed next to the box.
Note: This step can take some time to complete, especially for large areas such as a state.
6) Once the request is complete, all the riparian zones in the selected area will be displayed in yellow. The portions which match the selection criteria of canopy cover, solar gain, etc. will be displayed in black.

7) The resulting layer is added to the list of layers that you can view on the map. Click on the layer tool to see the list of layers.
8) Each layer has a unique name listing the HUC and the selection criteria. For example, the name at the bottom of the list geo_huc8337_c25_s35_e600
was created by selecting area HUC 8337 with canopy cover less than 25% and solar gain of 35% or more and elevation of 600 or more meters.
Once you have run several models, you can choose which to display by clicking on the check box for each model. You can also change the display by clicking on the radio buttons for Landscape or Satellite imagery, etc.


